
 I’ve been using Azure DevOps since the early days when the service carried the name Visual Studio Online. I’ve used the service for both professional projects and personal projects, and I’ve enjoyed the service so much I’ve demonstrated and recommended the service on consulting gigs, at workshops, at user groups, and in Pluralsight courses.
ADO has sometimes been a hard sell. The previous monikers for the service tied the product to Windows, Visual Studio, and Microsoft, so getting a Node developer to sit down and see a continuous delivery pipeline for a pure JS project wasn’t always easy. People already in the Microsoft ecosystem would also resist given the baggage of its on-premises ancestor, Team Foundation Services. And by baggage, I mean heavy enterprise baggage overstuffed with XML. I’ve gotten a lot of work done with TFS over the years, but TFS is also the only Microsoft product I’ve upgraded by hiring an external expert. I did not want to learn the installation incantations for the unholy amalgamation of TFS, SQL Server, SSRS, and SharePoint. TFS is also the only source code provider I’ve seen crash a commercial-grade network router while fetching source code.
But, the past is gone, and no other service exemplifies the evolution of Microsoft quite as well as evolution of TFS to Azure DevOps. We’ve gone from a centralized behemoth with an enterprise focus to a modern looking and sleek cloud platform that aggressively supports small open source projects as well as larger organizations.
Here are the constituent services that form Azure DevOps.
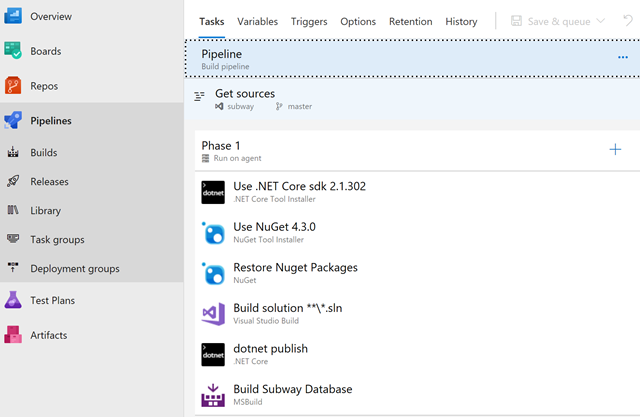
Pipelines provide a platform for building, testing, packaging, and deploying applications. It’s a feature rich build system that is extensible and easy to use. I’d consider this the crown jewel of Azure DevOps. All the heavy lifting uses build machines that the service transparently provisions in the cloud. Here are three more fun facts:
Pipelines are not tied to source control in Azure. You can pull source from public and private repositories, including GitHub.
Build minutes for OSS projects are free and unlimited.
You can build anything for anyone since the supported build environments include Linux, Windows and macOS.
My biggest complaint about Pipelines in the past has been the inability to define builds using source controlled text files instead of the web UI. Fortunately, YML files have come to the rescue and the ability to codify and version build and release definitions should soon be generally available.
Boards are where a team can track issues, bugs, work items, and epics. There are Kanban boards, of course, and custom workflows. The service is well featured, particularly since it is free for 5 users and about $9,000 USD a year for 100 users (note that developers with MSDN subscriptions will have free access). There are other products that have many more bells and whistles, but they’ll also start license negotiations at $20,000 for 100 users.
Git source control with an unlimited number of private or public repositories.
Automated tests will typically execute in a Pipeline. The Test Plans service is more of a place for tests not executing in a pipeline, so this service covers manual tests, and exploratory tests, as well as load tests (which are automated, but fall here for some reason).
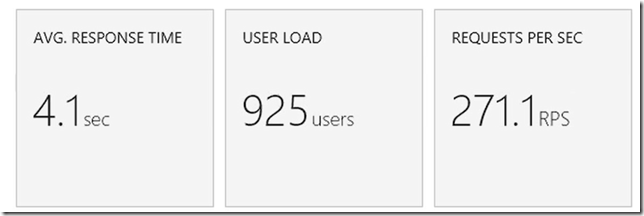
The load testing features are the only features I’m qualified to speak about since I’ve been using the testing tools in VS Enterprise for years. Unfortunately, the tools themselves remain pretty much unchanged over these years and feel dated. The test recorder requires Internet Explorer and a plugin. The “Browser Mix” feature will allow you to make HTTP requests using an IE9 UA string, but there is no mention of any browser released after IE9, and even having a browser mix feature in 2018 is questionable.
Behind the scenes, the load testing artifacts are relatively simple XML files, so it is possible to avoid the tools in some workflows.
On the plus side, the load testing framework can intelligently provision hardware in the cloud to generate load. There is no need to setup test agents and monitor the agents to see if they are overworked. See my Cloud Patterns course for more.
Your own ultimate package repository for Maven, npm, and NuGet packages. Publish packages here for internal use at your organization.
The app store for DevOps contains some high quality extensions. There is also an extensive HTTP API throughout the DevOps service to integrate with other products and your own custom utilities. Between the API and the custom extensions, there is always a way to make something work in DevOps, all you need is the will.
My opinion: GitHub is community focused, Azure DevOps is focused on organizations. But, there is some crossover. If you have an OSS project, you’ll want to host on GitHub and build in Pipelines.
Look for yourself at the aggressive and transparent evolution of Azure DevOps over the years. My only worry today is Azure DevOps using the word "DevOps" in the name. DevOps requires a way of thinking and a culture. I hope organizations don't adopt DevOps tools in the same way they adopted Agile tools and then proclaimed themselves Agile.
In a previous post I mentioned that a scripts directory can be a welcome addition to any source code repository. What goes into scripts? Anything you can automate to make a developer’s life easier!
Here’s a script I’ve used to simplify adding an EF migration. All I need to do from the command line is addmigration [migration_name].
pushd src\beaverleague.data
dotnet ef migrations add %1
dotnet ef database update
popd
I also have a recreatedb script I can use to start fresh after pulling changes.
pushd src\beaverleague.web
dotnet run dropdb migratedb seeddb stop
popd
More on how the parameters above work in a future post.
The EF repo itself uses a tools folder instead of a scripts folder, but the idea is the same. Inside you’ll find scripts to clean up test environments by dropping and shrinking databases, like this one that uses a combination of sqlcmd and sqllocaldb command line tools, as well as a script to query for all the non-system databases in a DB instance.
@echo off
sqlcmd -S "(localdb)\mssqllocaldb" -i "DropAllDatabases.sql" -o "DropAll.sql"

sqlcmd -S "(localdb)\mssqllocaldb" -i "DropAll.sql"

del "DropAll.sql"

sqllocaldb stop mssqllocaldb
sqllocaldb delete mssqllocaldb

ShrinkLocalDBModel.cmd
For more examples and ideas, checkout the TypeScript repo with scripts for everything from running tests to automating GitHub issues with OctoKit. There’s the vscode repo with scripts to setup an environment. The repo to build the official .NET Docker images includes Powershell scripts to execute docker pull with retries.
These are all examples where 5 or 6 lines of script code can not only save time for the entire team in the long run, but also codify a common operation.
I specifically want to call out special capabilities of the dotnet CLI tool. We’ve always had the ability to build, publish, and package from the command line, but the new global tools feature gives us an npm-ishly easy path to installing new tools and use them from anywhere.
Here are some of the tools I use.
Nate McMaster maintains a more complete list of global tools.
Take advantage of the command line renaissance in .NET Core to speed up a repeatable development process.
How does next know how to call the next piece of middleware in the HTTP processing pipeline? I’ve been asked this question more than once when helping to write middleware components for ASP.NET Core.
I thought it might be fun to answer the question by showing the code for an implementation of IApplicationBuilder. Keep in mind the code is meant to demonstrate how to build a middleware pipeline. There is no error handling, no optimizations, no pipeline branching features, and no service provider.
We want an app builder with a Use method just like a real application builder, that is a Use method that takes a Func<RequestDelegate, RequestDelegate>. This Func<> represents a middleware component.
When we invoke the function we have to pass in a next delegate that represents the next piece of middleware in the pipeline. What we get back when we invoke the function is a second function that we can use to process each individual HTTP request.
The code below looks just like the code in the Configure method of a web app, although the middleware doesn’t do any real work. Instead, the components write log statements into a fake HTTP context.
app.Use(next =>
{
    return async ctx =>
    {
        ctx.AddLogItem("Enter middleware 1");
        await next(ctx);
        ctx.AddLogItem("Exit middleware 1");
    };
});

app.Use(next =>
{
    return async ctx =>
    {
        ctx.AddLogItem("Enter middleware 2");
        await next(ctx);
        ctx.AddLogItem("Exit middleware 2");
    };
});

app.Use(next =>
{
    return async ctx =>
    {
        ctx.AddLogItem("Enter middleware 3");
        await next(ctx);
        ctx.AddLogItem("Exit middleware 3");
    };
});
If we were to look at the log created during execution of the test, we should see log entries in this order:
Enter middleware 1
Enter middleware 2
Enter middleware 3
Exit middleware 3
Exit middleware 2
Exit middleware 1
In a unit test with the above code, I expect to be able to use the app builder to build a pipeline for processing requests represented by an HttpContext.
var pipeline = app.Build();

var request = new TestHttpContext();
pipeline(request);

var log = request.GetLogItem();

Assert.Equal(6, log.Count);
Assert.Equal("Enter middleware 1", log[0]);
Assert.Equal("Exit middleware 1", log[5]);
Each time there is a call to app.Use, we are going to need to keep track of the middleware component the code is adding to the pipeline. We’ll use the following class to hold the component. The class will also hold the next pointer, which we’ll have to compute later after all the calls to Use are finished and we know which component comes next. We’ll also store the Process delegate, which represents the HTTP message processing function returned by the component Func (which we can’t invoke until we know what comes next).
public class MiddlewareComponentNode
{
    public RequestDelegate Next;
    public RequestDelegate Process;
    public Func<RequestDelegate, RequestDelegate> Component;
}
In the application builder class, we only need to store a list of the component being registered with each call to Use. Later, when building the pipeline, the ability to look forwards and backwards from a given component will prove useful, so we’ll add the components to a linked list.
public void Use(Func<RequestDelegate, RequestDelegate> component)
{
    var node = new MiddlewareComponentNode
    {
        Component = component
    };

    Components.AddLast(node);
}

LinkedList<MiddlewareComponentNode> Components = new LinkedList<MiddlewareComponentNode>();
The real magic happens in Build. We’ll start with the last component in the pipeline and loop until we reach the first component. For each component, we have to create the next delegate. next will either point to the processing function for the next middleware component, or for the last component, be a function we provide that has no logic, or maybe sets the response status to 404. Once we have the next delegate, we can invoke the component function to create the processing function itself.
public RequestDelegate Build()
{
    var node = Components.Last;
    while(node != null)
    {
        node.Value.Next = GetNextFunc(node);
        node.Value.Process = node.Value.Component(node.Value.Next);
        node = node.Previous;
    }
    return Components.First.Value.Process;
}

private RequestDelegate GetNextFunc(LinkedListNode<MiddlewareComponentNode> node)
{
    if(node.Next == null)
    {
        // no more middleware components left in the list
        return ctx =>
        {
            // consider a 404 status since no other middleware processed the request
            ctx.Response.StatusCode = 404;
            return Task.CompletedTask;
        };
    }
    else
    {
        return node.Next.Value.Process;
    }
}
This has been a "Build Your Own AppBuilder" excercise. "Build you own ________" exercises like this are a fun challenge and a good way to understand how a specific piece of software works behind the scene.
In addition to src and test folders, there are a few other top level folders I like to see in a repository for a .NET Core code base.
benchmarks – for performance sensitive projects. Benchmarks typically require a benchmarking framework and perhaps some custom applications. All of the benchmark related code can live inside this folder.
build – for build scripts and other build related files. Some build systems require build artifacts to live in the root of the repository, but supporting files can live here to avoid cluttering the root. More on build files in a future post.
docs – for markdown files, diagrams, and other documentation. There are a few possible audiences for this folder, depending on the project type. For OSS libraries, documentation could include contributor focused documentation, like build instructions and style guidelines. For business apps, the folder might target users with setup instructions.
samples – for code to demonstrate libraries and frameworks. My basic rule of thumb is that if the repo builds NuGet packages for other developers to consume, you’ll want a samples folder demonstrating some basic scenarios on how to use the package.
scripts – for scripts related to the project. These could be automation scripts for sample data, computer setup, cloud provisioning, or desired state configuration. More on scripts in a future post.
specs – for those projects building on published specs. Examples would be HL7 specifications for a health data parser, or the open language grammar for a parser.
tools – for utilities, possibly from a third part, that are required to build, run, or deploy the code.
As an aside, many of the benefits of .NET Core being open source are not related to the source itself, because we’ve always been able to get to the source code with tools like Reflector. Many of the benefits are seeing other artifacts like unit tests, sample projects, and experiments. When I was learning .NET Core, I found these other folders invaluable.
Coming up: more on the build and scripts folders.
When a client closes a connection during a long running web operation, it could be beneficial for some systems to take notice and stop work on creating the response.
There are two techniques you can use to detect an aborted request in ASP.NET Core. The first approach is to look at the RequestAborted property of HttpContext.
if (HttpContext.RequestAborted.IsCancellationRequested)
{
    // can stop working now
}
RequestAborted is a CancellationToken. Another approach is to allow model binding to pass this CancellationToken as an action parameter.
[HttpGet]
public async Task<ActionResult> GetHardWork(CancellationToken cancellationToken)
{
    // ...

    if (cancellationToken.IsCancellationRequested)
    {
        // stop!
    }

    // ...
}
And yes, both approaches work with the exact same object.
if(cancellationToken == HttpContext.RequestAborted)
{
    // this is true!
}
If you are hosted in IIS or IIS Express, the ASP.NET Core Module (ANCM) doesn’t tell ASP.NET Core to abort a request when the client disconnects. We know the ANCM is having some work done for the 2.2 release and moving to a faster in-process hosting model. Hopefully the 2.2 work will fix this issue, too.
One of the challenges in maintaining an orderly repository structure is seeing the repository structure, at least if you are a Visual Studio user. Studio’s Solution Explorer window shows us the structure of a solution, but this presentation, which can include virtual folders, will disguise the true structure on disk, and trying to create folders and arrange files with the default Solution Explorer view is impossible.
Thus, I recommend using the command line when creating projects, folders, and files that live outside of projects. The dotnet CLI can manage Visual Studio sln files, so starting a new project might look like this:
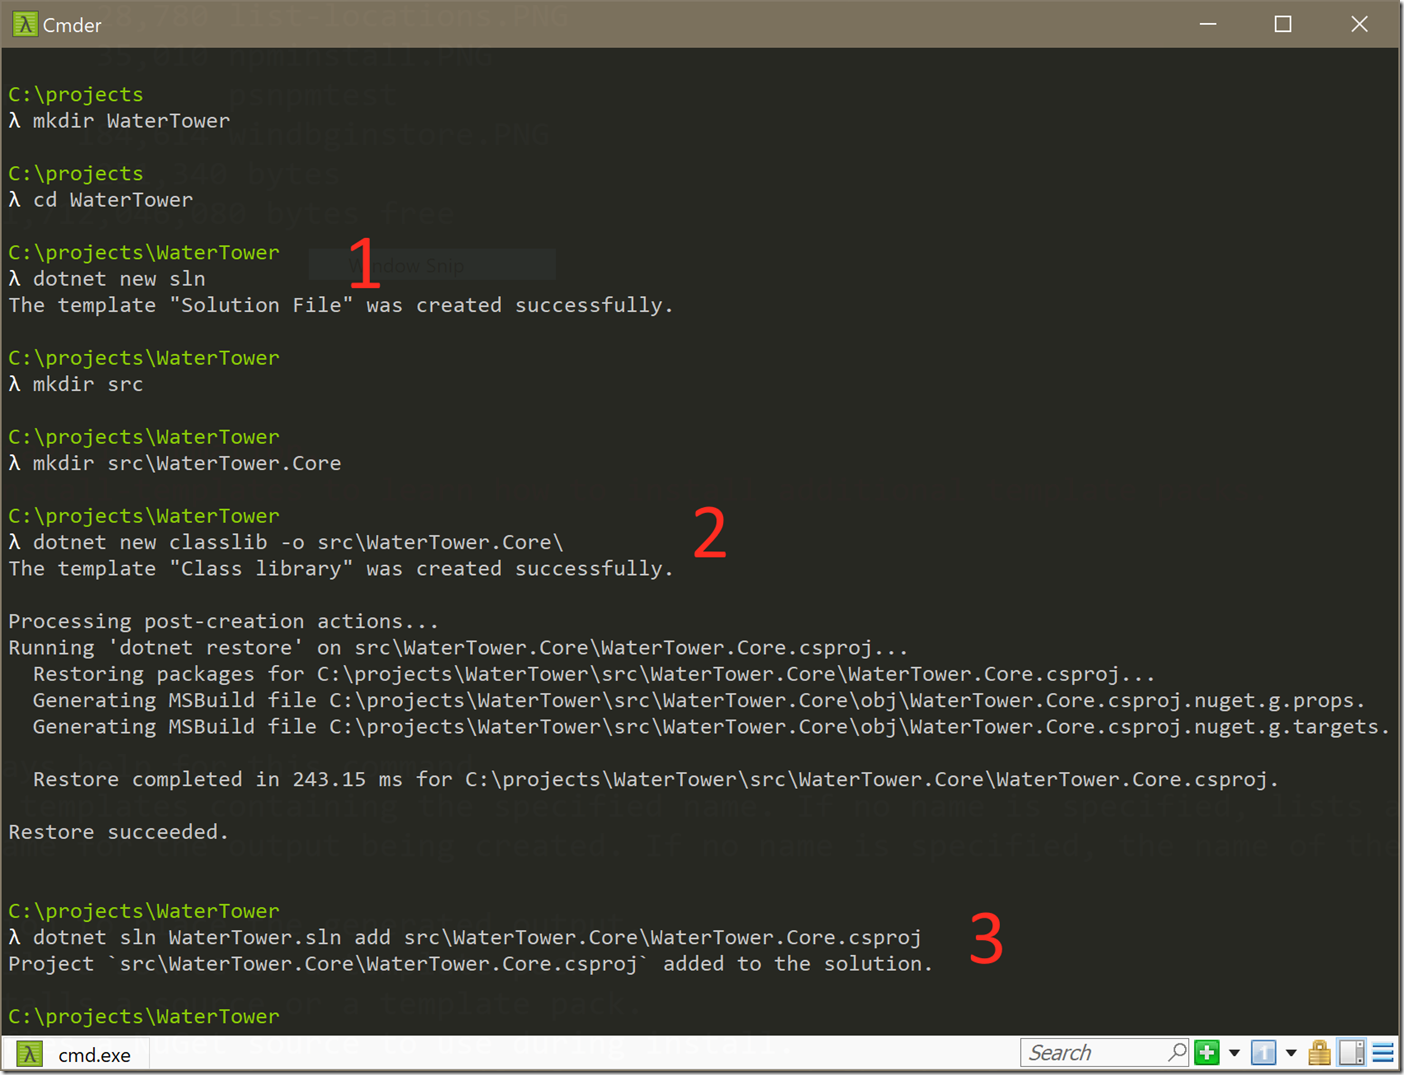
There are three key commands:
dotnet new sln # to create a sln filedotnet new [template_name] -o [output path] # to create a projectdotnet sln [sln_name] add [csproj_name] # to add a project to a solutition.At this point, you can open the solution in Visual Studio and the files are all in the correct place. Yes, there are three commands to remember, but I find the commands easier than fighting with Studio and remembering when to uncheck the 'create solution folder' option.
Here are two tips for those who can’t leave VS behind.
First, use the Blank Solution template in the File -> New Project dialog to get started. The Blank Solution allows you to create an empty sln file in exactly the location you need. Once the solution file is in place, you can add projects to the solution, but take care when specifying the path to the new project.
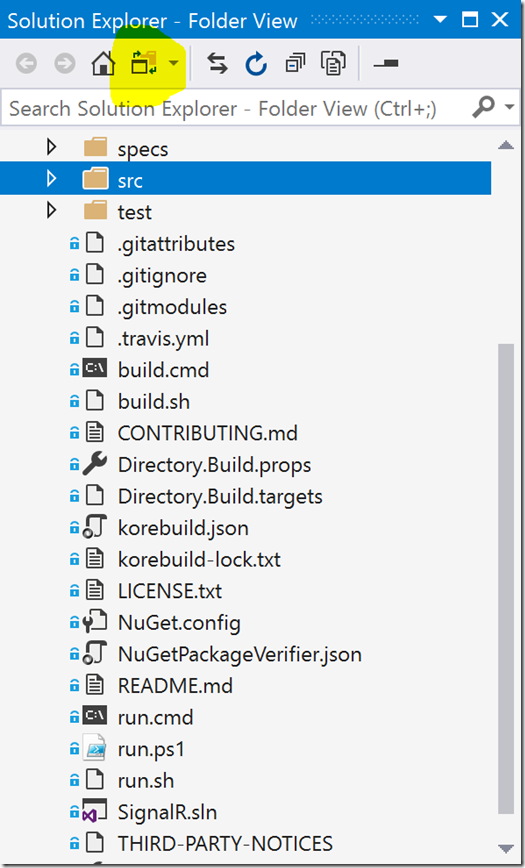
Secondly, the Solution Explorer in 2017 does have a mode where the explorer will show exactly what is on disk. You can toggle into this "Folder View" by clicking the icon in the toolbar shown in highlight below. From this view you can create folders that are real folders on disk, but you do lose some of the useful right-click context menus.
With the folder structure under control, I’ll move on to other artifacts I like to see in a repository next.
If you use npm to manage client-side dependencies for ASP.NET Core applications, and you deploy to Azure App Services using Git, then you need a way to run an npm install during deployment in App Services.
There are a few options available for customizing the Azure build and deployment process. One approach is to modify the deployment script Azure generates for your ASP.NET Core project. I’ve written about this previously in Customizing Node.js Deployments for Azure App Services
Of course, Node.js deployments in Azure will automatically run an npm install, so the previous example was showing how to add Webpack into the build, but you follow the same process to customize the build for ASP.NET Core.
You can also customize your build and publish operations by adding targets to the project’s .csproj file. For example:
<Target Condition="'$(DEPLOYMENT_TEMP)' != ''"
        Name="NpmInstall"
        AfterTargets="Publish">
  <Exec Command="npm install --production"
        WorkingDirectory="$(DEPLOYMENT_TEMP)">
  </Exec>
</Target>
The above Target will execute npm install after a dotnet publish operation in the DEPLOYMENT_TEMP folder. DEPLOYMENT_TEMP is one of the environment variables defined by Kudu in Azure.

 OdeToCode by K. Scott Allen
 Subscribe
 Twitter
 Search
 About
About
 Learn C#