
Continuing the story of replacing Windows Live Writer with some custom tools...
In addition to image uploads and code formatting, I also needed the ability to:
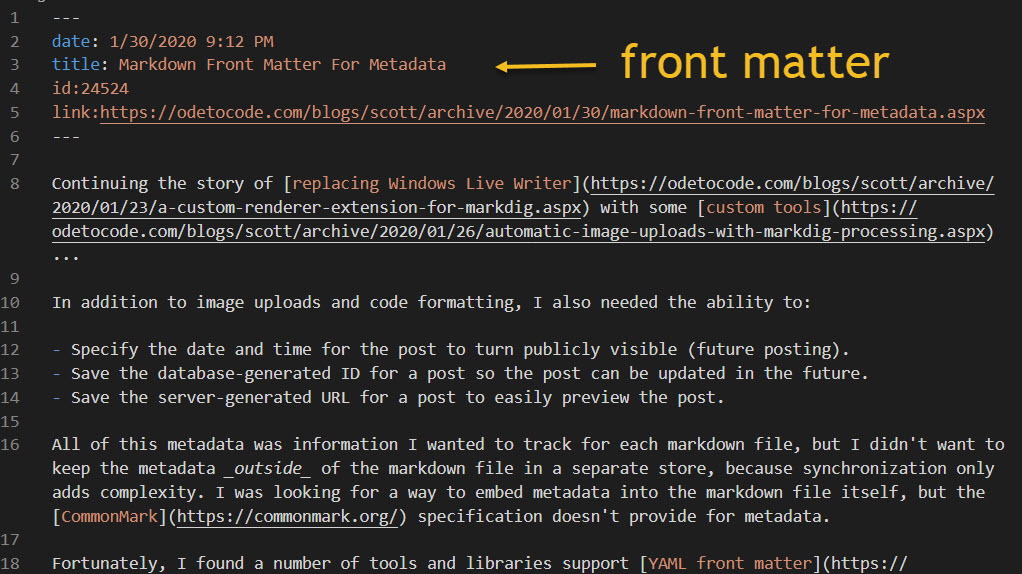
All of this metadata was information I wanted to track for each markdown file, but I didn't want to keep the metadata outside of the markdown file in a separate store, because synchronization only adds complexity. I was looking for a way to embed metadata into the markdown file itself, but the CommonMark specification doesn't provide for metadata.
Fortunately, I found a number of tools and libraries support YAML front matter in markdown. Front matter is easy to write, easy to parse, and a good solution if you need to keep metadata associated with your markdown with you markdown.
The picture below shows a post after publication, so the tools have added an ID and a URL. I add the date to publish and the title.
Continuing the story of replacing Windows Live Writer with some custom tools...
One of the best features of WLW was the ability to paste an image into a post and have the image magically appear on the server in an expected location. For my new workflow, I needed a second Markdig extension to look for images in a post and automatically upload the images through a WebAPI I built into this blog. The WebAPI returns the URL of the uploaded (or updated) image. This API, by the way, was a simple replacement for the ancient XML RPC API that WLW relied on.
For this extension I didn't need to custom render an image tag. Instead, I could wait until Markdig finished converting markdown into HTML and go looking for img tags. One way to implement this style of extension for Markdig is to implement the low level IMarkdownExtension interface.
public class ImageProcessingExtension : IMarkdownExtension
{
   private readonly IFileSystem fileSystem;
   private readonly IBlogServer blogServer;

   public ImageProcessingExtension(IFileSystem fileSystem, IBlogServer blogServer)
   {
       this.fileSystem = fileSystem;
       this.blogServer = blogServer;
   }

   public void Setup(MarkdownPipelineBuilder pipeline)
   {
       pipeline.DocumentProcessed += Pipeline_DocumentProcessed;
   }

   public void Setup(MarkdownPipeline pipeline, IMarkdownRenderer renderer)
   {
   }

   private void Pipeline_DocumentProcessed(MarkdownDocument document)
   {
       var damn = document.Descendants().ToArray();
       foreach(var node in document.Descendants()
                                   .OfType<LinkInline>()
                                   .Where(l => l.IsImage))
       {
           var localName = node.Url;
           if (!fileSystem.Exists(localName))
           {
               throw new ArgumentException($"Cannot find file {localName}");
           }
           var bytes = fileSystem.ReadBinary(localName);
           var newUrl = blogServer.UploadMedia(localName, bytes);
           node.Url = newUrl;
       }
   }
}
This extension searches the rendered HTML nodes for images, uploads the image in the URL, and then updates the URL with the remote address.
Note that all this happens inside an event handler which must return void. However, the UploadMedia method uses HttpClient behind the scenes, and must be async. As you know, async and void return types mix together like potassium and water - an example of why I say we must always await the async letdown.
A couple years ago I decided to stop using Windows Live Writer for authoring blog posts and build my own publishing tools using markdown and VSCode. Live Writer was a fantastic tool during its heyday, but some features started to feel cumbersome. Adding code into a blog post, as one example.
This blog uses SyntaxHighlighter to render code blocks, which requires HTML in a specific format. With WLW the HTML formatting required a toggle into HTML mode, or using an extension which was no longer supported in the OSS version of WLW.
What I really wanted was to author a post in markdown and use simple code fences to place code into a post.
``` csharp
public void AnOdeToCode()
{
}
```
Simple!
All I'd need is a markdown processor that would allow me to add some custom rendering for code fences.
Markdig is a fast, powerful, CommonMark compliant, extensible Markdown processor for .NET. Thanks to Rick Strahl for bringing the library to my attention. I use Markdig in my tools to transform a markdown file into HTML for posting here on the site.
There are at least a couple different techniques you can use to write an extension for Markdig. What I needed was an extension point to render SyntaxHighlighter flavored HTML for every code fence in a post. With Markdig, this means adding an HtmlOBjectRenderer into the processing pipeline.
public class PreCodeRenderer : HtmlObjectRenderer<CodeBlock>
{
    private CodeBlockRenderer originalCodeBlockRenderer;

    public PreCodeRenderer(CodeBlockRenderer originalCodeBlockRenderer = null)
    {
        this.originalCodeBlockRenderer = originalCodeBlockRenderer ?? new CodeBlockRenderer();
    }
    public bool OutputAttributesOnPre { get; set; }
    protected override void Write(HtmlRenderer renderer, CodeBlock obj)
    {
        renderer.EnsureLine();

        var fencedCodeBlock = obj as FencedCodeBlock;
        if (fencedCodeBlock?.Info != null)
        {
            renderer.Write($"<pre class=\"brush: {fencedCodeBlock.Info}; gutter: false; toolbar: false; \">");
            renderer.EnsureLine();
            renderer.WriteLeafRawLines(obj, true, true);
            renderer.WriteLine("</pre>");
        }
        else
        {
            originalCodeBlockRenderer.Write(renderer, obj);
        }
    }
}
Note that the Info property of a FencedCodeBlock will contain the info string, which is commonly used to specify the language of the code (csharp, xml, javascript, plain, go). The renderer builds a pre tag that SyntaxHighlighter will know how to use. The last step, the easy step, is to add PerCodeRenderer into a MarkdownPipelineBuilder before telling Markdig to process your markdown.
The C# Interactive window in VS is not the best interactive C# experience, LINQPad still has the honor, I believe, but it is a quick and convenient option for trying out a few lines of code.

There's actually two reasons why I tend to avoid using debuggers. The first reason is a genuine belief that debuggers encourage short term thinking and quick fixes in software. The second reason is the terrible sights and sounds I witness when I launch a debugger like the VS debugger. It is the noise of combustion and heavy gears engaging. My window arrangement shatters and the work space transforms into a day-trading app with real time graphs and event tickers. A modal dialog pops up and tells me a thread was caught inside the reverse flux capacitor and allowed to execute freely with side-effects. I don't know what any of this means or has to do with finding my off-by-one error, which only adds to my sense of fear and confusion.
One way I avoid the debugger is by adding better logging to my software. The best time to think about what you need to log is when the software is misbehaving, and ideally before the software misbehaves in front of strangers. Sometimes the logging becomes verbose.
logger.Verbose($"ABBREVIATIONS");;
for (var index = ABBRSTART; index <= ABBREND; index++)
{
    for (var number = 0; number < NUMABBR; number++)
    {
        var offset = (NUMABBR * (index - 1)) + (WORDSIZE * 2);
        logger.Verbose($"For [{index}][{number}] the offset is {offset}");

        var ppAbbreviation = machine.Memory.WordAt(Header.ABBREVIATIONS);
        logger.Verbose($"For [{index}][{number}] the ppointer is {ppAbbreviation:X}");

        var pAbbreviation = machine.Memory.WordAddressAt(ppAbbreviation + offset);
        logger.Verbose($"For [{index}][{number}] the pointer is {pAbbreviation:X}");

        var location = machine.Memory.SpanAt(pAbbreviation);
        var result = decoder.Decode(location).Text;

        logger.Verbose($"Abbreviation [{index}][{number}] : {result}");
    }
}
Verbosity works well if you categorize correctly. Again, the best proving ground for a logging strategy is when the software is misbehaving. You can learn what knobs you need to tweak and what categories work well. With Serilog, which I still prefer, you can set the category to match type names in your software, then configure the log messages you want to see using code or configuration files.
public ILogger CreateLogger()
{
    var logger = new LoggerConfiguration()
        .MinimumLevel.Warning()
        .MinimumLevel.Override(typeof(FrameCollection).FullName, LogEventLevel.Verbose)
        .MinimumLevel.Override(typeof(Machine).FullName, LogEventLevel.Verbose)
        .MinimumLevel.Override(typeof(DebugOutputStream).FullName, LogEventLevel.Verbose)
        .MinimumLevel.Override(typeof(Instruction).FullName, LogEventLevel.Verbose)
        .MinimumLevel.Override(typeof(ZStringDecoder).FullName, LogEventLevel.Verbose)
        .Enrich.FromLogContext()
        .WriteTo.File(@"trace.log",
                      outputTemplate: "{SourceContext:lj}\n{Message:lj}{NewLine}{Exception}")
        .CreateLogger();
    return logger;
}
To use logs during test runs you need to sink log events into XUnit's ITestOutputHelper. The logs are available from the VS test runner by clicking on an "Open additional output for this result" link.
For one particular integration style test I have, the logs can get lengthy, which leads to an amusing message from VS.

An editor like Notepad? Am I not already in a piece of software that can edit text? It's like having the GPS in a Tesla tell me I'll need to use a 1988 Oldsmobile to reach my destination.
I always feel a sense of satisfaction when I move a piece of complexity from outside an object to inside an object. It doesn't need to be a large amount of code, I've learned. Every little step helps in the long run.

If I could go back 20 years and give myself some programming tips, one of those tips would certainly be this: You don't move code into an abstraction to reuse the code, you move code into an abstraction to use the code.
This post originally appeared on the Progress Telerik blog.
We always want the best performance from the software we deploy to Azure App Services. Not only does better performance make our customers happy, but better performance can also save us money if we "do more with less" in Azure. In this article we'll look at settings and strategies for improving the performance of web applications and web APIs running in an Azure App Service. We'll start with some easy configuration changes you can make for an instant improvement.
Microsoft announced support for HTTP/2 in App Services early in 2018. However, when you create a new App Service today, Azure will start you with HTTP 1.1 configured as the default protocol. HTTP/2 brings major changes to our favorite web protocol, and many of the changes aim to improve performance and reduce latency on the web. For example, header compression and binary formatting in HTTP/2 will reduce payload sizes. An even better example is the use of request pipelineing and multiplexing. These features allow for more concurrent requests using fewer network sockets and help to avoid one slow request from blocking all subsequent requests, which is a frequent problem in HTTP 1.1 that we call the "head-of-line" blocking problem.
To configure your App Service to use HTTP/2 with the portal, go to Platform Settings in the Configuration blade. Here you will find a dropdown to specify the HTTP version. With 2.0 selected, any clients that support HTTP/2 will upgrade their connection automatically.

HTTP/2 might not benefit every application, so you will want to run performance tests and stress tests to document your improvements. Here's a simple test where I used the network tools in Firefox against a page hosted in an App Service. The page references a handful of script and CSS resources, and also includes 16 images. Each image is over 200 KB in size. First, I used the developer tools to record what happens on an App Service using HTTP 1.1. Notice how the later requests start in a blocked state (the red section of the bars). This is the dreaded "head-of-line blocking" problem where limitations on the number of connections and concurrent requests throttle the throughput between the client and the server. The client doesn't receive the final bytes for the page until 800ms after the first request starts.

Next, I switched on HTTP/2 support in the App Service. I didn't need to make any other configuration changes on the client or the server. The last byte arrives in less than 500ms. We avoid blocking thanks to the improved network utilization of HTTP/2.

In front of every Azure App Service is a load balancer, even if you only run a single instance of your App Service Plan. The load balancer intercepts every request heading for your app service so when you do move to multiple instances of an app service plan, the load balancer can start to balance the request load against available instances. By default, Azure will make sure clients continue reaching the same app service instance during a session, because Azure can't guarantee your application isn't storing session state in server memory. To provide this behavior the load balancer will inject a cookie into the first response to a client. This cookie is what Azure calls the Application Request Routing Cookie.
If you have a stateless application and can allow the load balancer to distribute requests across instances without regard to previous requests, then turn off the routing cookie in the Configuration blade to improve performance and resiliency. You won't have requests waiting for a server restart, and when failures do happen, the load balancer can shift clients to a working instance quickly.
The routing configuration is another item you'll find in the Platform Settings of the App Service Configuration blade.

If you've deployed applications into IIS in the past, you'll know that IIS will unload idle web sites after a period of inactivity. Azure App Services will also unload idle web sites. Although the unloading can free up resources for other applications that might be running on the same App Service Plan, this strategy hurts the performance of the app because the next incoming request will wait as the web application starts from nothing. Web application startup time can be notoriously slow, regardless of the technologies involved. The caches are empty, the connection pools are empty, and all requests are slower than normal as the site needs to warms up.
To prevent the idle shutdown, you can set the Always On flag in the App Service Configuration blade.

By default, the file system for your App Service is mounted from Azure Storage. The good news is your file system is durable, highly available, and accessible from multiple App Service instances. The sad news is your application makes a network call every time the app touches the file system. Some applications require the Azure Storage solution. These are the applications that write to the file system, perhaps when a user uploads a file, and they expect the file system changes to be durable, permanent, and immediately visible across all running instances of the application. Other applications might benefit from having a faster, local, read-only copy of the web site content. If this sounds like your application, or you want to run a test, then create a new App Setting for the app with a key of WEBSITE_LOCAL_CACHE_OPTION and a value of Always. You'll then have a d:\home folder pointing to a local cache on the machine and populated with a copy of your site content.

Although I say the cache is read-only, the truth is you can write into the local cache folder. However, you'll lose any changes you make after an app restart. For more information on the tradeoffs involved and how the local cache works with log files, see the Azure App Service Local Cache overview.
All the performance improvements we've looked at so far only require configuration changes. The next set of improvements require some additional infrastructure planning or restructuring, and in some cases changes to the application itself. The common theme in the next set of tips is to reduce the distance bits need to travel over the network. The speed of light is finite, so the further a bit has to travel, the longer the bit needs to reach a destination.
In Azure you assign most resources you create to a specific region. For example, when I create an App Service, I can place the service close to me in the East US region, or, if I'm on an extended visit to Europe, I can select the North Europe region. If you create multiple resources that work together closely, you'll want to place the resources together in the same region. In the past I've seen performance suffer when someone at the company accidentally places an App Service in one region and an associated Azure SQL instance in a different region. Every database query from the App Service becomes a trip across the continent, or around the world.
How do you check your existing subscriptions to make sure your resources are properly co-located? Assuming you don't want to click through the portal to check manually, you can write a custom script or program, or use Azure Policy. Azure Policy has a built-in rule to check every resource to ensure the resource location matches the location of the resource's parent resource group. All you need to do with this rule in place is make sure your associated resources are all in the same resource group. The policy definition for this audit rule looks like the following.
{
  "if": {
    "field": "location",
    "notIn": [
      "[resourcegroup().location]",
      "global"
    ]
  },
  "then": {
    "effect": "audit"
  }
}
If most of your customer traffic originates from a specific area of the world, it makes sense to place your resources in the Azure region closest to your customers. Of course, many of us have customers fairly distributed around the world. In this case, you might consider geo-replicating your resources across multiple Azure regions and stay close to everyone. For App Services, this means creating multiple App Service plans inside of multiple Azure data centers around the world. Then, you'll typically use a technology like Azure Traffic Manager to direct customer traffic to the closest App Service instance.
Note: since I wrote this article, Microsoft introduced Azure Front Door. Front Door offers some additional capabilities that are not available from Traffic Manager. Features like SSL offload, instead failover, and DDoS protection. If you need global load balancing, you should also look at what the Front Door Service offers.
Traffic Manager is a DNS based load balancer. So, when a customer's web browser asks for the IP address associated with your application's domain, Traffic Manager can use rules you provide and other heuristics to select the IP address of a specific App Service. Traffic Manager can select the App Service with the lowest latency for a given customer request, or, you can also configure Traffic Manager to enforce geo-fencing where the load balancer sends all customers living in a specific province or country to the App Service you select. You can see the routing methods built into Traffic Manager in the Create Traffic Manager profile blade below.

There are tradeoffs and complications introduced by Traffic Manager. It is easy to replicate stateless web applications and web services across data centers around the world, but you'll need to spend some time planning a data access strategy. Keeping one database as the only source of truth is the easiest data access approach. But, if your App Service in Australia is reading data from a database in the U.K., you might be losing the performance benefits of geo-replicating the App Service. Another option is to replicate your data, too, but much depends on your business requirements for consistency. Data replication is typically asynchronous and delayed, and your business might not be able to live with the implications of eventual consistency.
Azure's content delivery network allows you to take static content from Azure Storage, or from inside your App Service, and distribute the content to edge servers around the world. Again, the idea is to reduce the distance information need to travel, and therefore reduce the latency in network requests. Static files like script files, images, CSS files, and videos, and are all good candidates for caching on the CDN edge servers. A CDN can have other benefits, too. Since your App Service doesn't need to spend time or bandwidth serving files cached on a CDN, it has more resources available to produce your dynamic content.
When setting up a CDN profile in Azure, you can select a pricing plan with the features you need from a set of providers that includes Microsoft, Verizon, and Akamai.

Today's architecture fashion is to decompose systems into a set of microservices. These microservices need to communicate with each other to process customer requests. Just like keeping your application and database close together can benefit performance, keeping your microservices close to each other can benefit performance, too.
With App Services, remember that multiple services can live on the same App Service Plan. Think of the plan like a virtual machine dedicated to the role of a web server. You can place as many applications on the web server as you like, and keeping services together can reduce network latency. However, keep in mind that having too many services on the same machine can stretch resources thin. It will take some experimentation and testing to figure out the best distribution of services, the ideal size of the App Service Plans, and the number of instances you need to handle all your customer requests.
We've looked at several strategies we can use to improve the performance of web applications and web APIs we've deployed to Azure App Services. Just remember that your first step before trying one of these strategies should be to measure your application performance and obtain a good baseline number. Not every strategy in this article will benefit every application. Starting with baseline performance numbers will allow you to compare strategies and see which ones are the most effective for your application.

 OdeToCode by K. Scott Allen
 Subscribe
 Twitter
 Search
 About
About
 Learn C#