Visual Studio 2005 ships with a few handy visualizers for debugging. A visualizer presents a tailored view of an object, which is useful when an object is too complex to fit in a watch window or data tip. Custom visualizers can plug into Visual Studio, see “How To: Write a Visualizer” as a starting point.

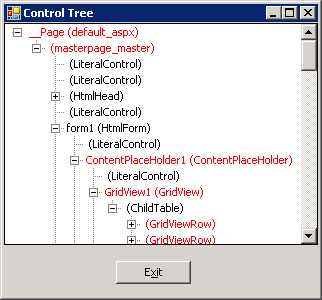
I’ve packaged up a couple custom visualizers I’ve used recently into a project: WebVisualizers.zip. The ControlTree visualizer shows the hierarchical relationship of web controls, starting with the visualized control at the top. For instance, if you hover over a this reference inside a web form class, and click the magnifying glass that appears, you’ll see all the controls on a form.
Controls implementing the INamingContainer interface appear in red. This visualizer was helpful in tracking down a misuse of FindControl. The second visualizer in the project will display an HttpCookieCollection in a grid view.
To install the a visualizer you have to build the source code. You can build with Visual Studio, or from the command line “msbuild OdeToCode.WebVisualizers.csproj”, assuming msbuild.exe is in the path. Copy the .dll from underneath the bin directory into “MyDocuments\Visual Studio 2005\Visualizers”. VS.NET will automatically load the assembly when debugging, and inspect the metadata inside to know what types to visualize. Note: custom visualizers won't load for a web site running at less than full trust.
These Visualizers here are relatively simple. Brett Johnson wrote a visualizer for the ASP.NET cache, and a wicked-cool visualizer to render controls.

 OdeToCode by K. Scott Allen