
By now we’ve all heard of Reporting Services - Microsofts latest add-on to SQL Server, or should have at any rate, and there seems to be a level of excitement about this new product. The fact that the reporting solutions market really needed a new entrant hasn’t been in any doubt – anyone who has gone through the frustration of using Crystal or worse still having to interface with it, will testify to that. So lets take a first look at Reporting Services a new entrant to this market. Initially Reporting services was supposed to be released as a part of Yukon, Microsoft decided to release this earlier. The public beta is out, and the release is scheduled for Jan 27th 2004. That’s the first piece of good news, however it gets better, Reporting Services is an add-on to SQL 2000 so we don’t have to shell out money for this. The designer is a part of Visual Studio.NET 2003, and since this is a site primarily targeted towards Microsoft developers – I assume you all have that as well. I’m assuming you all know how to get Reporting Services – http://www.microsoft.com/sql/reporting/default.asp - register for the beta.
Lets look at how we are going to create our first Reporting Services Project. We are going to open VS 2003 and create a new Project. The project name is ‘Demo’, as is the solution name, and for the purpose of this example we are going to use the Report Project Wizard to create our first report. (Figure 1).
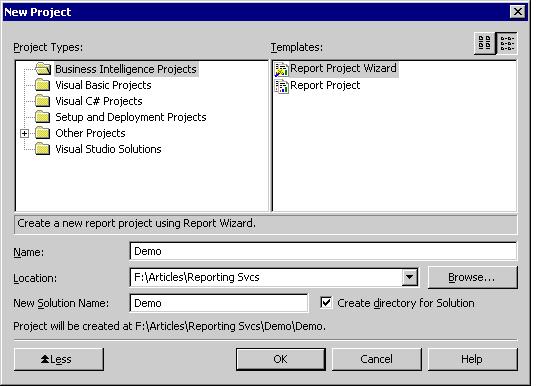
Figure 1
As we can see in Figure 1, all this does is specify, that this is a ‘Business Intelligence Project’ – and that the name of the project and the solution is ‘Demo’. We specify the path where this is going to reside and that we are going to use the Report Project Wizard to build our first report.
The next screen we encounter enables us to define the data source (Figure 2). The information we can feed at this point is the name and type of the data source, the connection string and the credentials we are going to use to connect to this data source. Reporting Services provides us with a gamut of available data sources: - ODBC, OLE-DB etc., but for our purposes we are going to stick to SQL Server. We call our data source ‘DemoDS’; the data source type is SQL Server,
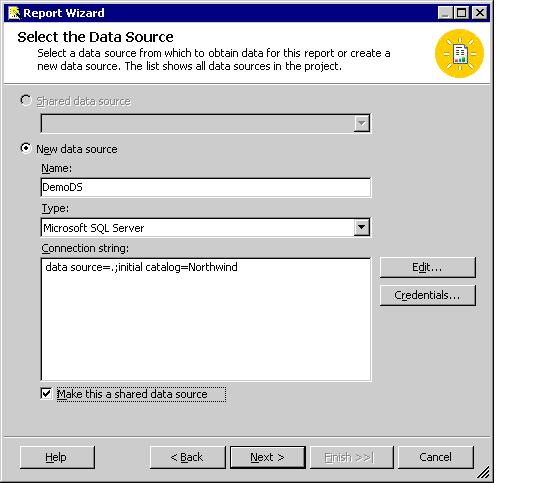 BR>Figure 2
We are going to make our data source a shared data source. The data source ‘DemoDS’ is not going to be unique to the report ‘Customers’ that we are going to create later in this article however one which can be used by all reports in this project. It is stored as an xml file in the project (Figure 3).
<?xml version="1.0" encoding="utf-8"?>
<RptDataSource xmlns:xsd="http://www.w3.org/2001/XMLSchema"
xmlns:xsi="http://www.w3.org/2001/XMLSchema-instance">
<Name>DemoDS</Name>
<DataSourceID>bc71659f-c793-4095-ada7-fdde376701a8</DataSourceID>
<ConnectionProperties>
<Extension>SQL</Extension>
<ConnectString>data source=.;initial catalog=Northwind</ConnectString>
</ConnectionProperties>
</RptDataSource>
Figure 3
Having finished with our data source definition, we now move to the ‘Design the Query’ window. To keep it simple we are going to enter
Select * from Customers
In the query box
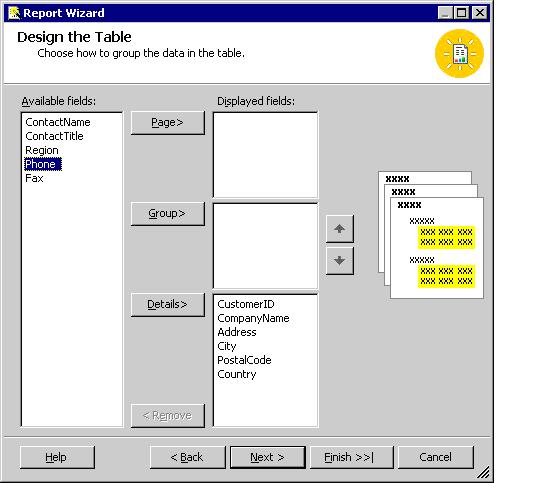
The subsequent screens ask us to ‘Select the Report Type’ and we choose tabular
And choose a few fields we want to display in the detail section of this report. Again we are trying to keep this simple; hence we’re not going to use the ‘Page’ or ‘Group’ boxes for this sample.
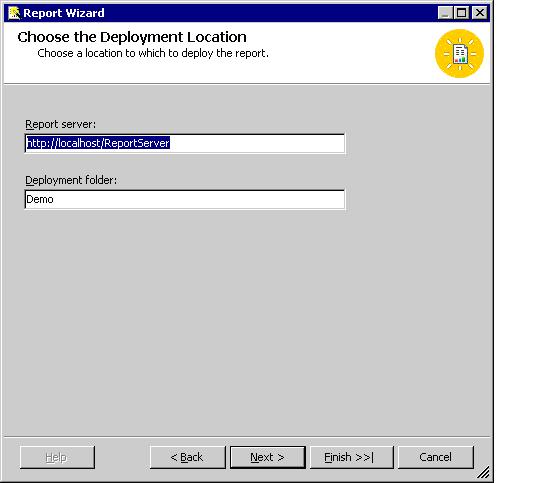
We go with the default location that we are prompted with by the Deployment Location Window. If you accepted the default when you were installing Reporting Services, your report server will be ReportServer too, otherwise it will be whatever you specified at install time.
And now finally possibly less then 10 minutes after we started defining our first reporting services project and report (albeit a very simple one) we can click the ‘Finish’ button and are close to done.
At this point we have the Visual Studio UI open before us. On the right side of your screen, you should see Solution Explorer with two objects defined, the data source ‘DemoDS’ and the report ‘Customers’ in the project. In the Designer Section we can see what the report layout looks like, and if we click the ‘Preview’ tab we can get a quick look at our report. At this stage we proceed to ‘build the project’ following which we ‘Deploy the project’
At this point we are officially done, just go to your web browser and type in ‘http://servrname/reports’ and you will see the project ‘Demo’ and if I drill down the report ‘Customers’. At this point we haven’t taken care of security, who has access to the reports, or programmed any complex reports, but the idea of this article was to show how easy it is to deploy a reporting application over the web. Till the advent of Reporting Services the delivery of Business reports, required coding of web pages, which took time and resources or buying 3rd party software – also expensive. With reporting services, the average business user can generate simple reports for themselves without requiring expensive IT resources.
by Llama Lopon


 Subscribe
 Twitter
 Search
 About
About
 Learn C#