
The debugger in Visual Studio 2005 is an amazing piece of software. You can debug C# and C++, Visual Basic and VBScript. Step over managed code, native code, mobile code, and T-SQL code. You can debug locally, or you can debug remotely. You can debug assemblies hosted by SQL Server, and JavaScript hosted by Internet Explorer. There is just-in-time debugging and just my code debugging. You can step into XML web services and into XSL transformations. The debugger has data tips, and data visualizers, breakpoints and tracepoints. You can inspect threads, modules, memory, and call stacks; you can view both local and global variables.
If you have a bug you can’t track down with Visual Studio, you’ve got yourself a real sticky problem.
Getting Started
You’ll generally start a debugging session in Visual Studio.NET in one of three ways. If you are inside of Visual Studio with an open project, you can use the Debug menu to get started. The “Start” and “Step Into” commands will both launch your application and begin a debugging session.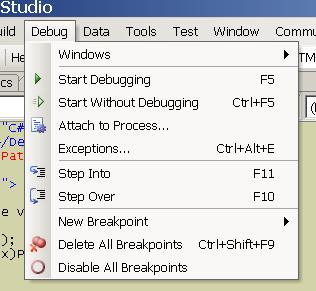
A second option is to use the “Attach to Process…” command on the Debug menu. The Attach command will let you break into a running application and begin a debug session. The Attach command is popular for web application developers who want to debug an already running instance of a web application or web service hosted by IIS. ASP.NET applications will run in either an aspnet_wp.exe process (for IIS 5.x), or a w3wp.exe process (for IIS 6.0).
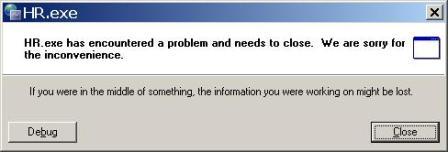
A final method for beginning a debugging session is to wait for Just-In-Time debugging to step in during an application crash. For managed .NET code, a crash (or program termination, if you prefer the term), will occur if the main application thread throws an exception and there is no exception handler to catch the exception. On a regular user’s computer the application will terminate. On a computer with debugging tools installed, the JIT debugger will step in and allow you to start a Visual Studio debugging session. If the application has source code and debug symbols present, Visual Studio can take you directly to the line of code responsible for the unhandled exception.
Note: ASP.NET developers won’t be able to take advantage of JIT debugging. The ASP.NET runtime will not let an unhandled exception terminate the application. Instead, the runtime will catch exceptions and return an HTTP error code to the client along with an error message.
Debug Symbols
What are debug symbols? Debug symbols are vital for a successful debugging session. Debug symbols help the debugger correlate instructions in your application back to file names and line numbers in your source code. Debug symbols are stored in a program database file with a .pdb extension. Without a .pdb file present, you won’t be able to step through the lines of code in your application.
When you create a new project with Visual Studio .NET, you’ll find the IDE creates two build configurations for your application (unless your project is a web project). You can see these configurations under the Configuration option of the Build menu. There is a Release configuration, which compiles your application so that the application will run as efficiently as possible. There is also a Debug configuration. The debug configuration compiles your application for the best debugging experience. In addition to creating PDB files, a debug build will also disable optimizations. Compiler optimizations will often rearrange instructions to increase performance or reduce memory consumption. The rearrangement of instructions can confuse the debugger.
For ASP.NET web applications and web services, you can enable a debug build in the compilation settings of web.config. Alternatively, if you pre-compile your application, you can use flags with the pre-compilation tool to generate .pdb files with debugging symbols.
Breakpoints
Debugging is all about collecting information and finding out what is wrong in your application. Part of the trick in collecting information is pausing, or breaking into the execution of your application at just the right spot. When the debugger is in break mode, you can examine objects and local variables to see what is going awry. We use breakpoints to tell the debugger where and when we want to pause the execution of our application.
 A common method to set a breakpoint is to press F9 while the cursor is on the line of code you want to break on. When a breakpoint is set, a round, red glyph will appear in the left margin of the editor. You can also click in this area of the editor to add a breakpoint. Right click on an existing breakpoint glyph to set properties, disable, or delete the breakpoint.
When execution reaches a breakpoint, the debugger pauses all of the application’s threads and allows you to inspect the state of your application, as we’ll see later. However, we might not want the debugger to pause the app every time we hit the breakpoint, but only in certain circumstances…
Conditions and Hit Counts
Most of the time you’ll add a plain breakpoint to an application and not set any special properties. If you open up the breakpoint window (from the Debug menu, select Windows -> Breakpoints), you’ll notice a breakpoint can use conditions and hit counts. Conditions and hit counts are useful if you don’t want the debugger to halt execution every time the program reaches the breakpoint, but only when a condition is true, or a condition has changed, or execution has reached the breakpoint a specified number of times.
 Conditions and hit counts are useful when setting breakpoints inside of a loop. For example, if your code iterates through a collection of Customer objects ith a for each loop, and you want to break on the 10th iteration of the loop, you can specify a hit count of 10. If something bad only happens when the Customer object’s Name property is equal to “Scott”, you can right click the breakpoint glyph, select Condition from the context menu, and enter the expression customer.Name == “Scott” into the breakpoint condition textbox. Intellisense is available in this textbox to ensure you are using the correct syntax.
Breaking On Exceptions
Another way to halt execution of a program is to ask the debugger to break when an exception occurs. By default, the debugger will only break if the exception goes unhandled, but this behavior is configurable. Select Exceptions from the Debug menu and you’ll see a tree display of all possible exceptions alongside checkboxes to indicate if the debugger should break when an exception “is thrown”, or only break if the exception is “user-unhandled”.
 You can ask the debugger to break on a broad category of exceptions (such as break on all Common Language Runtime Exceptions), or a category of exceptions from a namespace (such as any System.Data.SqlClient exception), or on a specific exception (like System.IO.IOException). Breaking on exceptions can be useful when you are trying to track down an exception that occurs, but have not determined under what condition the exception occurs, or where the exception occurs.
Stepping Through Code
Once you pause execution you have the ability to step through code, in other words, execute code one line at a time. From the debug menu there is a Step Into command (F11) . If you are currently in break mode on a line of code that contains a method call, the Step Into command will enter the method and break again on the first line of code inside the mehtod. In contrast, the Step Over command will execute the entire method call and break on the next line of code in the current method. Use Step Into if you want to see what happens inside a method call; use Step Over if you only want to execute the entire method and continue in the current code block.
 If the instruction pointer is currently on a line of code that does not contain a method call, Step Over and Step Into will both move the instruction pointer to the next line of code.
The debug menu also contains a Step Out command, which you can use when you want to execute the rest of the current method and return to the calling method. Step Out will break execution at the return point in the calling function.
Two more tips: right-clicking on a line of code and selecting the ‘Run To Cursor’ will put the application into run mode until execution reaches the specified line of code. Also, you can click and drag the yellow instruction point with the mouse to skip code, or to re-execute code.
Viewing State
Another crucial feature to have in a debugger is the ability to see and visualize the data in your application. Fortunately, Visual Studio offers plenty of options to view data, and to customize the views of data.DataTips
One of the common techniques to view the data inside a variable is to place the mouse cursor over the variable in code and allow Visual Studio to display a DataTip. DataTips are only available when the program is in break mode.
 If the object you are inspecting is a complex object, structure, or array, there will be a plus sign (+) to the left of the tip. If you hover over the + you can expand the DataTip to view additional fields and properties of the object in a tree like view. If the object you are inspecting has a property that itself represents another complex object, you can continue to expand the nodes of the tree and drill further and further into the object.
When viewing a DataTip you can edit writeable values of the object by right clicking the tip and selecting “Edit Value”, or by left clicking the value itself. Press the Ctrl key to temporarily hide the DataTip.
Variable Windows
DataTips are a transient display of information – once your mouse leaves the DataTip area the DataTip display will disappear. If you want a permanent display of an object’s value you can use one of the many variable windows.
 A Watch Window will display an object’s state until you explicitly remove the object from the window. You can add a variable to the watch window by right clicking a variable and selecting “Add Watch”. The watch window supports the ability to “drill down” into a complex object with the same sort of tree view capability that a DataTip window has.
You can also open a locals window from the Debug menu (Windows -> Locals). The locals window will automatically display all local variables in the current block of code. If you are inside of a method, the locals window will display the method parameters and locally defined variables. The Autos window (Debug -> Windows -> Autos) will display variables and expressions from the current line of code, and the preceding line of code.
Visualizers
A visualizer is a new way to view data in Visual Studio 2005. Some dataypes are too complex to display in a DataTip or watch window. For example, a DataSet is a tremendously complex and hierarchical object. Trying to drill into the 5th column of the 10th row of the 2nd table of a DataSet is cumbersome. Fortunately, a Visualizer exists for DataSet objects that will display the data in a more natural environment, namely an editable data grid.
 Whenever a magnifying glass appears in a DataTip or watch window there is a visualizer available for the object. Double click on the magnifying glass to use the default visualizer. If multiple visualizers are available, you can click on the drop down chevron next to the magnifying glass and select which visualizer you’d like to use. For instance, a string will have three visualizers available: a text visualizer, an HTML visualizer, and an XML visualizer. There is also a visualizer for the DataSet and DataTable classes.
Wrap Up
When your program is buggy, Visual Studio will give you all the tools you need to track down the error. Control the execution of your application with breakpoints, and use variable windows, data tips, and visualizers to inspect state along the way.
Comments? Questions? Leave them on my blog.


 Subscribe
 Twitter
 Search
 About
About
 Learn C#