
Last week I had an idea for visualizing the flow of patient data through an algorithmic process and tried out d3.js. d3 is short for data-driven documents. If you follow the previous link you’ll find some impressive visualizations made with d3 and SVG (the d3 Show Reel is just one example).
d3 is a bit jQuery-ish in the sense it can manipulate the DOM, select elements, and set attributes. For the work I was doing there are 2 distinguishing features of d3:
- d3 can join elements with data sources. The end result is similar to using a repeater with data binding.
- d3 can use a function to calculate attribute values instead of using hard coded values.
For example, let’s say we have the following data:.
var data =
[
    { name: "Cost" },
    { name: "Scope" },
    { name: "Time" }
];
We’ll combine the data with some d3 code:
d3.selectAll("p")
  .data(data)
  .enter()
  .append("p")
  .text(function(d) { return d.name });
The d3 API takes some work to understand, but the above code reads like this:
 1. Find all paragraph elements in the document.
2. Join the elements with the data array
3. If there is a data element with no paragraph …
4. Then append a new paragraph to the document
5. And set the text of the paragraph to the name attribute of each data item
The result being that three new paragraphs will appear on the page using text from the data array. Of course this example is uninspiring and entirely boring, but also easy to understand.
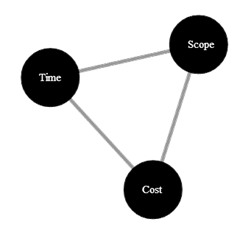
Another great feature of d3 are the layouts the library supports. The force layout uses verlet integration (one of my favorites) to constrain object positions. Let’s use the same data as earlier, but this time use SVG and a force layout to create the famous iron triangle of project management (but in this case a triangle that no matter how far you pull of the edges, the triangle will always rebalance itself).
First, we’ll need to augment our data with some links. d3 will process the source and target values in data links as array indexes into the data array and know that cost relates to scope, scope relates to time, and time relates to cost.
var data =
  [
    { name: "Cost" },
    { name: "Scope" },
    { name: "Time" }
  ];

var dataLinks =
  [
    { source: 0, target: 1 },
    { source: 1, target: 2 },
    { source: 2, target: 0 }
  ];
The next step is to create the force layout given an area of 960x500, keeping a distance of 220px between nodes, and maintaining a slight negative charge (repulsion) between elements. There is also a “game loop” setup using a tick function to update the screen (we’ll see it later).
var force =
    d3.layout.force()
      .size([960, 500])
      .nodes(data)
      .links(dataLinks)
      .linkDistance(220)
      .charge(-20)
      .on("tick", tick);
The layout is an abstraction in the sense it will set x and y properties on our data and link objects, but it is up to us to make something appear on the screen. So, we’ll use d3 to create an svg element in the document, then a <line> for each link, and a <circle> and <text> for each data element.
var svg = d3.select("body").append("svg")
            .attr("width", 960)
            .attr("height", 500);

var links = svg.selectAll(".link")
               .data(dataLinks)
               .enter().append("line")
               .attr("class", "link");

var nodes = svg.selectAll(".node")
               .data(data)
               .enter().append("circle")
               .attr("class", "node")
               .attr("r", 40)
               .call(force.drag);

var text = svg.selectAll(".text")
              .data(data)
              .enter()
              .append("text").attr("class", "text")
              .text(function (d) { return d.name; });

force.start();
As the force layout applies its logic it will update x and y properties on our data elements and links. Now it is our job to update all the lines, circles, and text elements on each tick loop with their associated values from the data objects. As objects are dragged around the screen, the force layout will continue to update these values.
function tick() {
    links.attr("x1", function (d) { return d.source.x; })
        .attr("y1", function (d) { return d.source.y; })
        .attr("x2", function (d) { return d.target.x; })
        .attr("y2", function (d) { return d.target.y; });

    nodes.attr("cx", function (d) { return d.x; })
        .attr("cy", function (d) { return d.y; });

    text.attr("x", function (d) { return d.x - 15; })
        .attr("y", function (d) { return d.y + 5; })
        .text(function (d) { return d.name; });
}
The end result is the “perfect project manager” who always keeps the iron triangle perfectly balanced.
Try it for yourself at http://jsfiddle.net/By5vH/3/.

 OdeToCode by K. Scott Allen
 Subscribe
 Twitter
 Search
 About
About
 Learn C#